
AEO is now close to 2 years old and we’re beginning to see telltale signs of SEO-like overthinking and misunderstanding creep into it. Currently, metrics and reporting is the function where you can find the most obvious signs.
Let’s get two things out of the way. First, there is no single number that can tell you whether your AEO program is working. Second, your LLM brand visibility score obscures more data than it reveals. It’s useful and table-stakes, but don’t rely only on that number alone to measure AEO success.
I believe the metrics below, combined with your LLM brand visibility score, are the best indicators of how well you’re appearing in LLMs and the impact that visibility is having on your revenue.
Let’s dive in.
1. Self-attributed LLM revenue
Ask closed-wons how they found you. Create a box in your forms and record people’s answers in your CRM. At the end of the quarter, measure how many people credited LLMs.
This is an obvious place to start. Self-reported attribution has long been one of the best ways of evaluating content program performance, which for some companies, like AEO, boils down to a brand marketing exercise.
There is no secret sauce to this metric. If your org has a deep reporting bench, compare self-attributed values to that visitor’s session source and medium.
A divergence there will give you insight into how your buyers’ journeys unfold. In turn, that gives you valuable data to feed into your content intelligence loop.
2. Organic branded and direct traffic
Direct traffic is a proxy (not an exact measurement) of the amount of agentic traffic your website receives. Branded organic traffic measures how many people came to your site after typing your brand name into a search engine.
Measure your organic branded and direct traffic numbers over time. If agents and people are finding you via LLMs, both these numbers should rise. We’ve observed through client work that direct traffic often begins rising before branded does, especially if brand footprint is smaller compared to the competition.
So why these two metrics? And why am I grouping them together?
Direct traffic approximates the agentic traffic your website receives. Due to privacy guards, web browsers often strip traffic referral and UTM data from URLs, leading to LLM origin traffic (whether human or agentic) into the Direct bucket in GA4.
The need for branded organic traffic is perhaps easier to understand. Think of how you found a recommendation in ChatGPT. You probably read a list of names and then searched for the name or website in your browser, creating branded traffic.
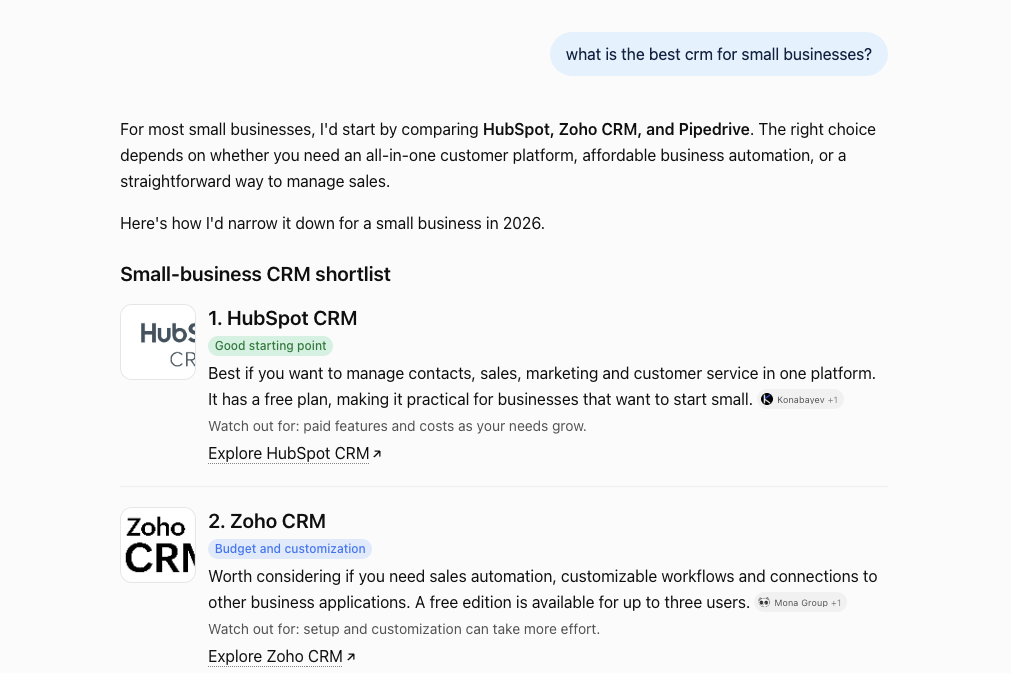 List of CRMs in ChatGPT. People either click the link or search for the brand name later.
Also, LLM chats are another surface for your brand to appear in. If you’re showing up in more surfaces, your brand should become more popular. This is what branded organic traffic captures.
By themselves, these metrics tell a story, but not a compelling one. Direct traffic could contain a lot of noise. Branded traffic increases could be the result of a sales campaign.
Put the two together though, and you have a story worth exploring.
If they’re rising together, you can reasonably infer your LLM visibility might be increasing. A divergence leads to even more interesting areas to explore:
- Direct rising but branded falling. If your LLM visibility score is rising, there’s a good chance you’re tracking the wrong prompts, or you’re showing up in the wrong way (see Brand sentiment below). If LLM visibility score is dropping, you’re probably being cited (see Citation rates) but not recommended. Either way, your program needs fixes.
- Branded rising but direct falling. If the LLM visibility score is rising, your program is probably working. If the LLM visibility score is dropping, some other factor is driving organic visibility and it probably isn’t LLMs.
Storytelling is the theme here. Dig into your data and explore what’s going on with your AEO program.
3. Overall relative visibility
This metric compares your brand’s visibility to your competitors’ numbers. In most LLM platforms, this is as simple as looking at the brand leaderboard.
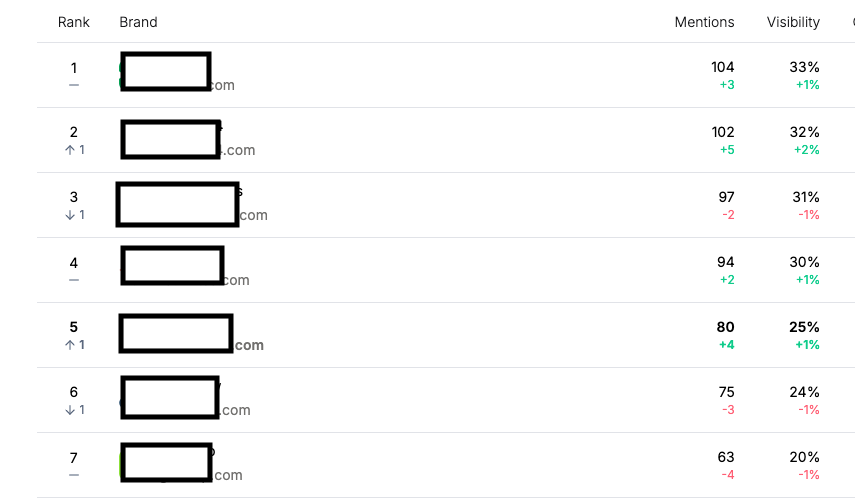
While a simple metric to understand, relative visibility quickly contextualises your overall visibility number. Let’s say your overall number is 25%. That sounds terrible or incomplete at best. But if the top-ranked competitor’s visibility is 26%, you now know how close you are to the top.
A caveat here: this metric is heavily influenced by the prompts you choose to track. Prompt creation deserves an entire article to itself so I’ll refrain from diving deep into that here. For now, make sure you’re placing your overall visibility number in the right context by tracking this metric.
4. Brand sentiment
Brand sentiment measures whether you’re being mentioned positively or negatively in LLMs. It draws a line between appearing in LLMs versus appearing the way you want to.
This metric, like the previous one, is heavily dependent on the prompts you choose to track. It also depends on the nuances behind the LLM visibility platform you’re using to measure performance. For instance, if you track informational queries, you’re not likely to be mentioned in answers.
Some platforms could mark this as a neutral (since you aren’t mentioned) while others mark it as a positive (since no bad news is good news, apparently). Make sure you dig into how your visibility platform defines brand sentiment.
For instance, some platforms run a separate batch of queries to measure sentiment. These are different from the ones you’re tracking. Personally, this is something I’m not fond of since it leads to all kinds of metric gaming possibilities.
Also, I believe we should be tracking buying prompts that result in brand recommendations. Why would I track a separate set of queries for sentiment? I believe brand visibility and sentiment are each half of the picture.
Separating them, by tracking different sets of prompts, makes no sense to me.
Since we’re veering into prompt design again, all I’ll say is: make sure you’re not biasing LLM responses by mentioning brand names (competitor or yours) nor sentiment in queries. For instance, look at the example below.
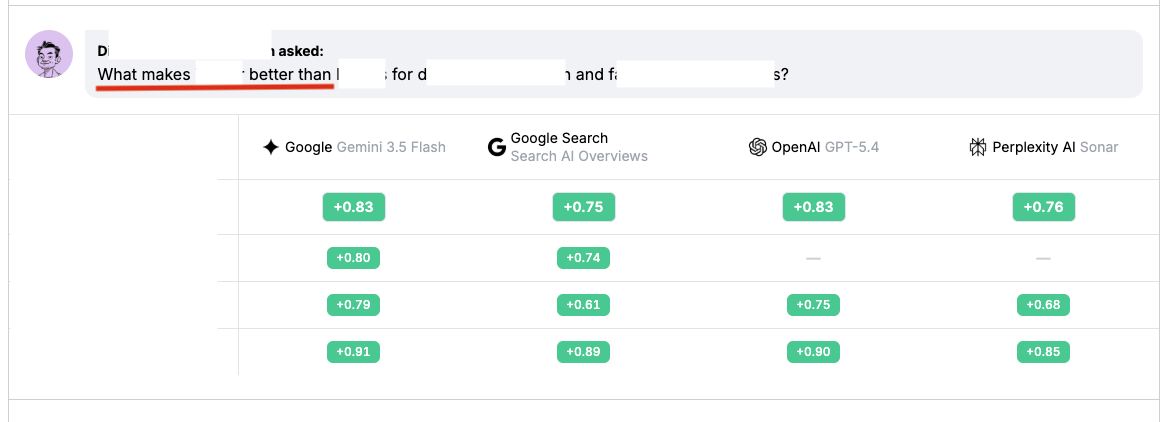 An example of a prompt that biases responses toward a positive response, boosting positive sentiment.
Avoid that.
5. Relative topic-level visibility
Relative topic-level visibility measures how well you’re showing up for a set of prompts within a topic category compared to the rest of the field. Think of this as a double click into your overall visibility number.
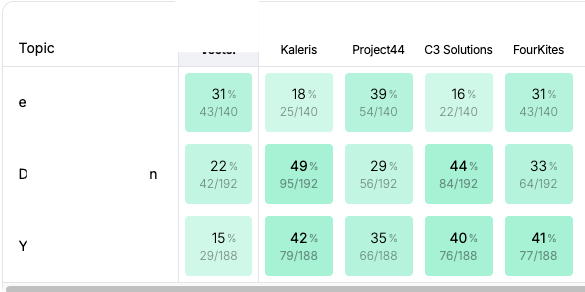
The key to getting this metric right is to choose prompt topics or categories that align with how you think about your program’s goal. For instance, if revenue is the bottom line goal, create categories around product lines. If you’d like to measure brand visibility, create categories around themes or product use cases.
Some tools let you create multiple categories, but watch out for prompts getting reclassified. A prompt that covers product line A (its category) might belong in brand visibility category X. Make sure you’re comparing apples to apples when tracking multiple sets of categories.
6. Brand coherence
Brand coherence measures how consistently you talk about your company and products on your owned and earned assets. Simply put, are you repeating consistent messaging or are you contradicting yourself?
All the metrics we’ve looked at so far draw themselves from an underlying number or data. Brand coherence is different. Sure, you could narrow it down to a number, but I view this as a qualitative metric.
More than any other metric on this list, brand coherence measures the foundation of your LLM visibility. Why? Because LLM visibility and AEO success is an exercise in brand marketing, not demand generation as the SEO migrants will imply.
LLMs need a cohesive picture of what your brand is about before they choose to recommend you. Unless your brand is well established, any incoherence or inconsistency in messaging will see you being dropped in favour of a competitor. One of the first tasks Krossings does with new clients is audit their brand consistency.
We look at messaging consistency between pages, old blog posts, earned media assets, and third-party websites. We correct those inconsistencies before doing anything else. As I said, this is a foundational metric.
You won’t see this metric move much unless you directly change messaging and copy on your pages. But it’s worthwhile to track in the long run. For instance, if anyone mentions you incorrectly, you can detect it and, if possible, correct it immediately.
7. Engine-level visibility
Engine-level visibility measures your brand’s visibility in different LLM platforms. It is a deceptively simple metric but tells you a lot about which factors are pushing your brand’s visibility higher (or lower).
One reason I love this metric is it reveals which factors we control in LLM experiments affect which engine. For instance, we’ve noticed off-site earned media citations tend to boost ChatGPT visibility but don’t do much for Perplexity. SEO performance does not correlate with Gemini visibility. And so on.
Another reason this metric is important is that it stops strong visibility on one engine masking weakness in another. You can correlate this metric to self-attribution (the first metric) to check whether you’re appearing in the engines your customers spend the most time on.
You could take this further, as we do, and rank all factors in a matrix and evaluate how well you’re performing across all the attributes you’re experimenting with. This will guide the next experiment and give you an idea of how each engine behaves.
8. Technical metrics
I’ll admit, I’m not a fan of technical metrics since from experience, I’ve never seen them offer anything beyond marginal gain. Yes, your website should adhere to technical requirements. But these aren’t some ridiculously difficult standards to hit.
My approach is to audit money pages (defined as the home page and product and solutions pages) each month to check if any factor is off. If it is, hand it over to your web dev and let them have at it.
The easiest way to measure this metric is to use your LLM visibility platform’s technical audit function.
9. Product and brand perception
Product and brand perception analyses the themes your company is found for. It gives you the chance to review whether you’re showing up the right way or if there’s missing (or wrong) information about you floating out there.
For instance, we had an interesting situation with a client where their brand name was the same as another popular company, in an entirely different niche. When people asked LLMs about that name, our client’s information was being confused with the other brand.
Insights like these do not show up if you’re just tracking your prompt list. Those answers tell you how you show up in specific situations. Neither does a sentiment analysis (metric 4 above) tell you what terms you’re being found for in AI engines.
However, given AEO’s situation as a brand marketing exercise, this information is critical. In this case, the fix was complex and involved heavy on-page fixes plus SEO boosts. None of this would have happened if we weren’t paying attention to this metric.
Overrated metrics
I’ve covered important metrics and no doubt, you’ll be wondering “where is X”. Here are some metrics that I find are either overrated or plain wrong.
Events from LLM traffic
This is a common one and measures what actions occur (conversions, demos, clicks, and so on) from LLM referral traffic. While not an incorrect metric, I find this besides the point. Attributing a demo click to an LLM referral doesn’t make sense to me in a B2B environment, given the amount of research buyers conduct.
If someone clicks through an LLM and books a demo, that either means they went through a multi-turn conversation you cannot replicate (since it’s complex) or they conducted research elsewhere and you’re misattributing the conversion to an LLM.
Track it, but I don’t think it’s as important as the list above.
Citation rates
I’ll get flak for this but citation rates do not tell us anything useful about AEO success. This metric tells you LLMs are reading your content and surfacing information. But are they producing clickthroughs? Are they enhancing your brand?
A citation does not mean you’re being mentioned or recommended. Also, if your brand is heavily present in the LLM’s training data, you won’t be explicitly cited since the LLM considers it ingrained information. This happens with older companies who have been around for a while.
Try telling IBM they have an LLM visibility problem because they’re not being cited enough.
AI share of voice
AI share of voice, borrowed from Semrush’s SEO share of voice metric, measures how often you’re showing up compared to the competition, and in which engines. It’s a maths-heavy metric that makes a lot of sense, but ultimately, drives little action.
One reason is, it makes visibility opaque instead of transparent. It reduces visibility to a seemingly catch-all number that does nothing to push further action. The metrics I’ve listed previously do so and break up the share of voice, giving you much better insights into onward action.
Many metrics, one conclusion
I’m sure as AEO evolves we’ll see more metrics added to our lists. For now, I truly believe the metrics above are the best measurement of your AEO program’s effectiveness. Watch out for pseudo-scientific metrics that promise a single number to end all your AEO woes.
They’re usually fake (like ones derived from prompt search volumes) or opaque (like share of voice).
Want to see how your brand scores in the LLMs? Book a free revenue diagnostic today and you’ll receive a full content audit that grades your brand’s presence on LLMs and in the buying committee.